Use Case
How to Build Custom Reporting Dashboards in Looker Studio/DataBox
A reporting dashboard is crucial for every business aiming to make informed, strategic decisions. This is why most modern business tools have integrated insights and reporting features that show user interactions. However, generic dashboards often fail to provide in-depth, concrete insights.
Solutions like Looker and DataBox offer a way to build advanced, personalized dashboards that provide real-time, actionable data across various business functions. These two platforms can help to gain a deeper understanding of your data and drive a more scientific decision-making process. Let’s take a closer look at each of these powerful data presentation tools.
What is Looker?
Looker, a leading business intelligence (BI) platform by Google Cloud, offers an end-to-end solution for integrating data from multiple sources, creating dynamic visualizations, and sharing insights across teams. Its robust data modeling capabilities make it a top choice for advanced analytics.
What is DataBox?
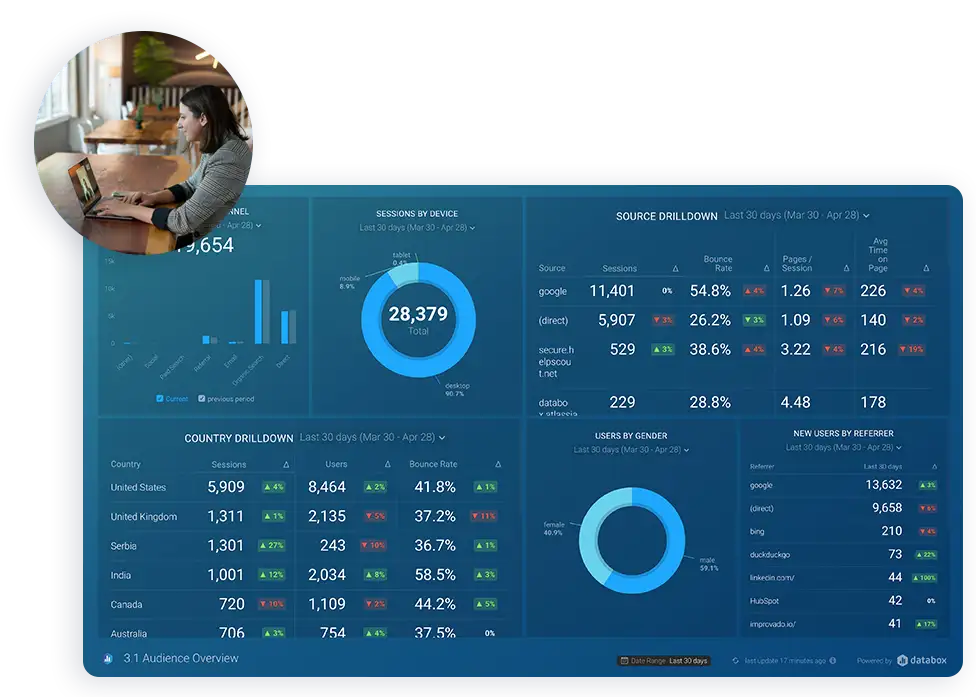
DataBox simplifies data reporting through its intuitive interface, pre-built integrations, and customizable templates. It is designed to be user-friendly and helps to quickly deploy and customize dashboards to meet specific needs without the complexity of traditional BI tools.
5 Advantages of Building Custom Dashboards in Looker/DataBox
Unified Data Access
You can import data from various sources into Looker or Databox and have a comprehensive view of how users interact with your digital assets. This unified access is crucial for breaking down silos and sharing the same data set with all teams.
Real-Time Analytics
Looker and DataBox process data on the fly. Your dashboards always reflect the most current information, which is vital for maintaining agility in the modern business environment.
Customizable Reporting
Utilize drag-and-drop functionality and pre-built templates to design dashboards that meet the unique needs of your business. Whether you need in-depth analytics or simplified reports, both platforms offer the flexibility to customize dashboards that align with your goals.
Mobile-First Experience
Looker and DataBox dashboards have mobile-friendly designs that allow teams to have access to critical insights anytime and stay connected, whether they’re in the office or on the go.
Enhanced Collaboration
Facilitate better teamwork and strategic alignment through robust sharing and collaboration features. These platforms make it easy to distribute insights across departments and keep everyone working toward the same objectives.
How to Build Comprehensive Reporting Dashboards with Looker/Databox
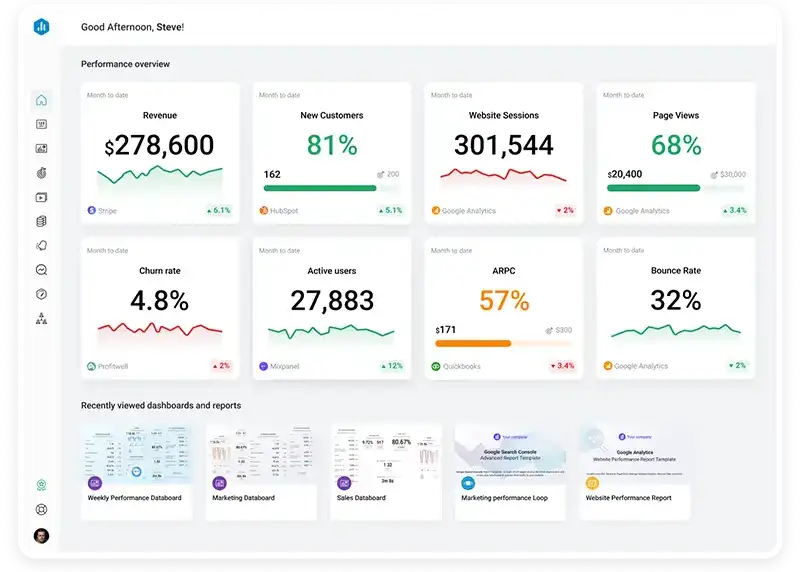
Needs Assessment
Begin by identifying the specific business functions—such as sales, marketing, finance, and operations—that will benefit from customized dashboards. Understanding the most relevant data sources and metrics for each department is key to designing effective dashboards.
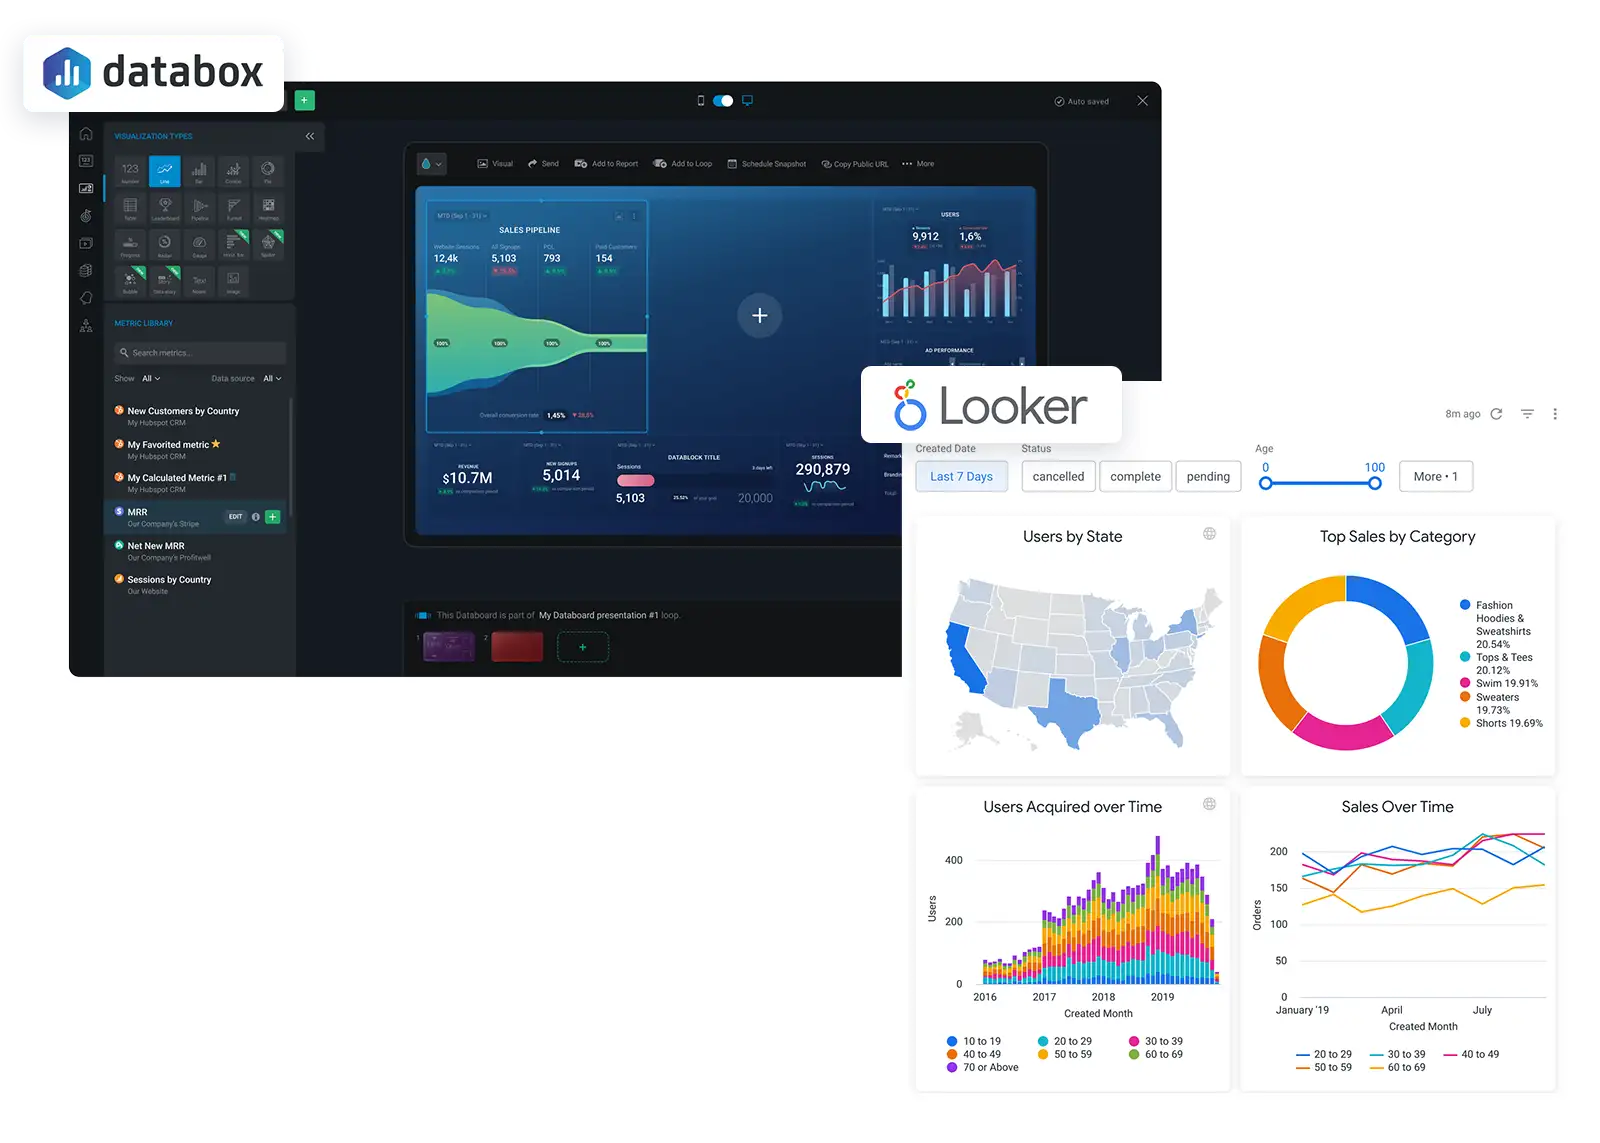
Platform Selection
Choose between Looker and DataBox based on your organization’s needs. Looker is ideal for complex data modeling and advanced analytics, while DataBox offers a quicker, more user-friendly solution for those requiring straightforward deployment.
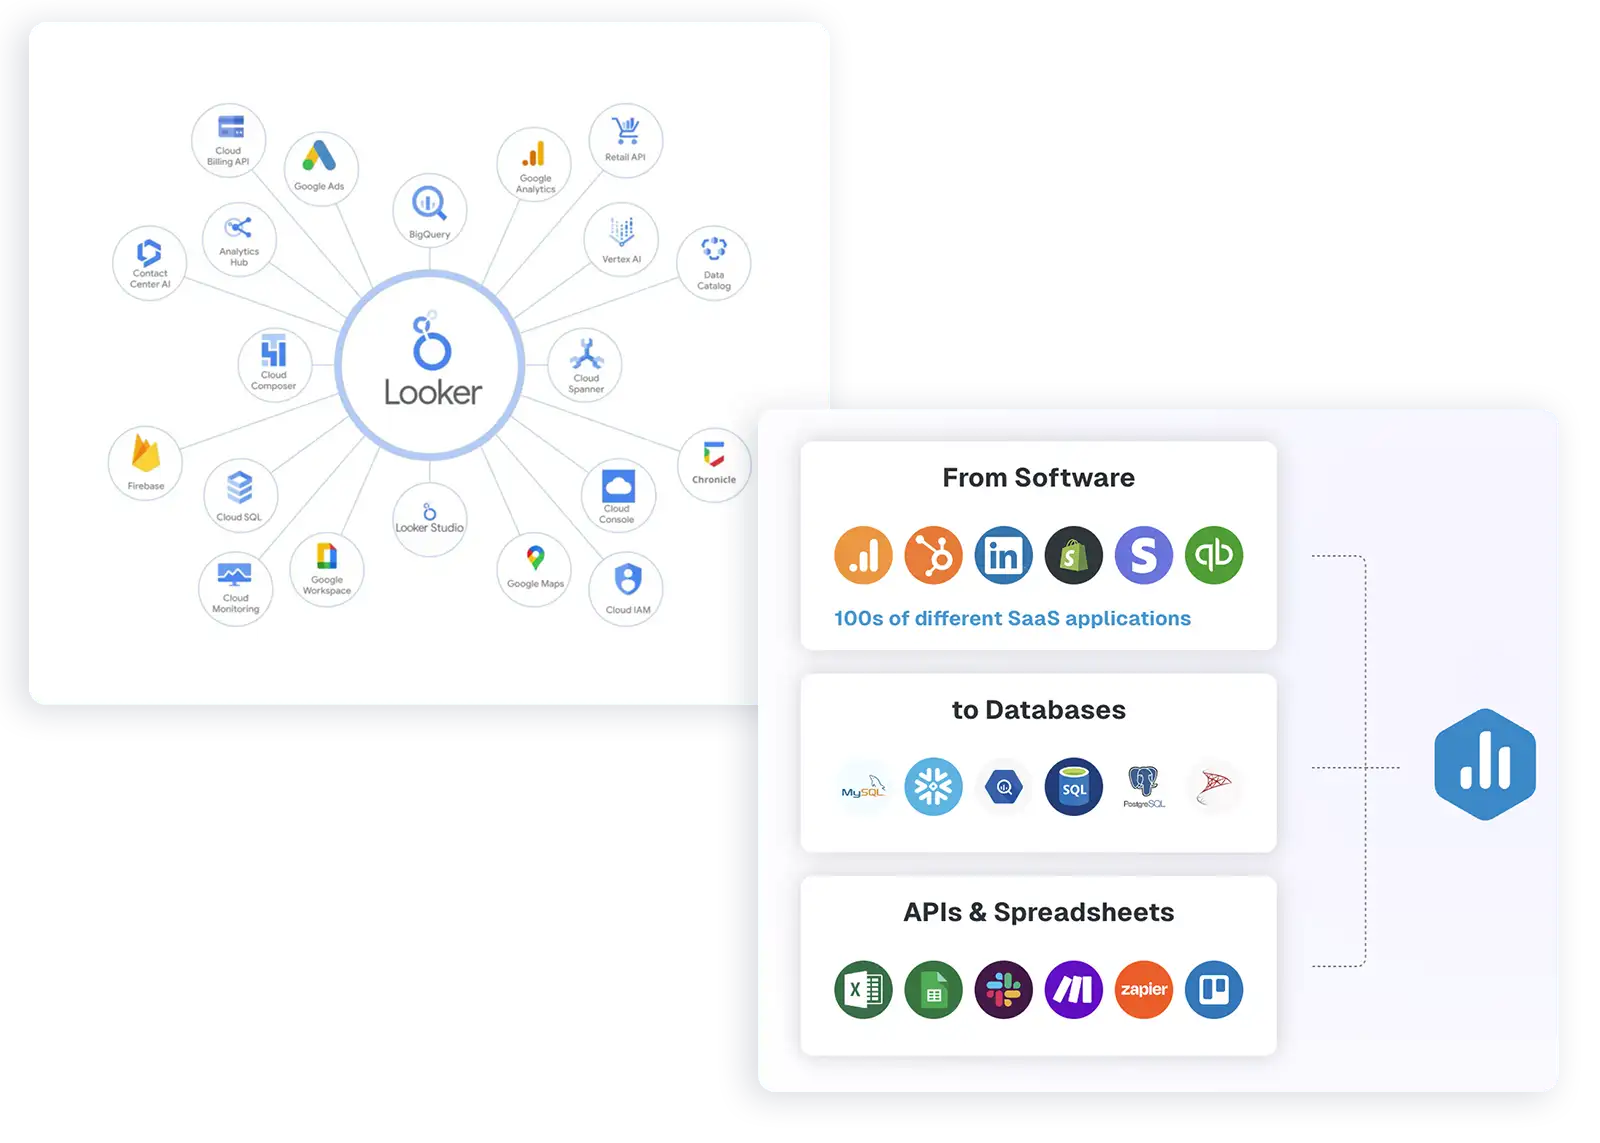
Data Integration
Connect Looker or DataBox to your existing data sources, including CRM systems, marketing platforms, and ERP software. Looker’s integration with Google BigQuery and other data warehouses is helpful if you plan to analyze large data sets efficiently.
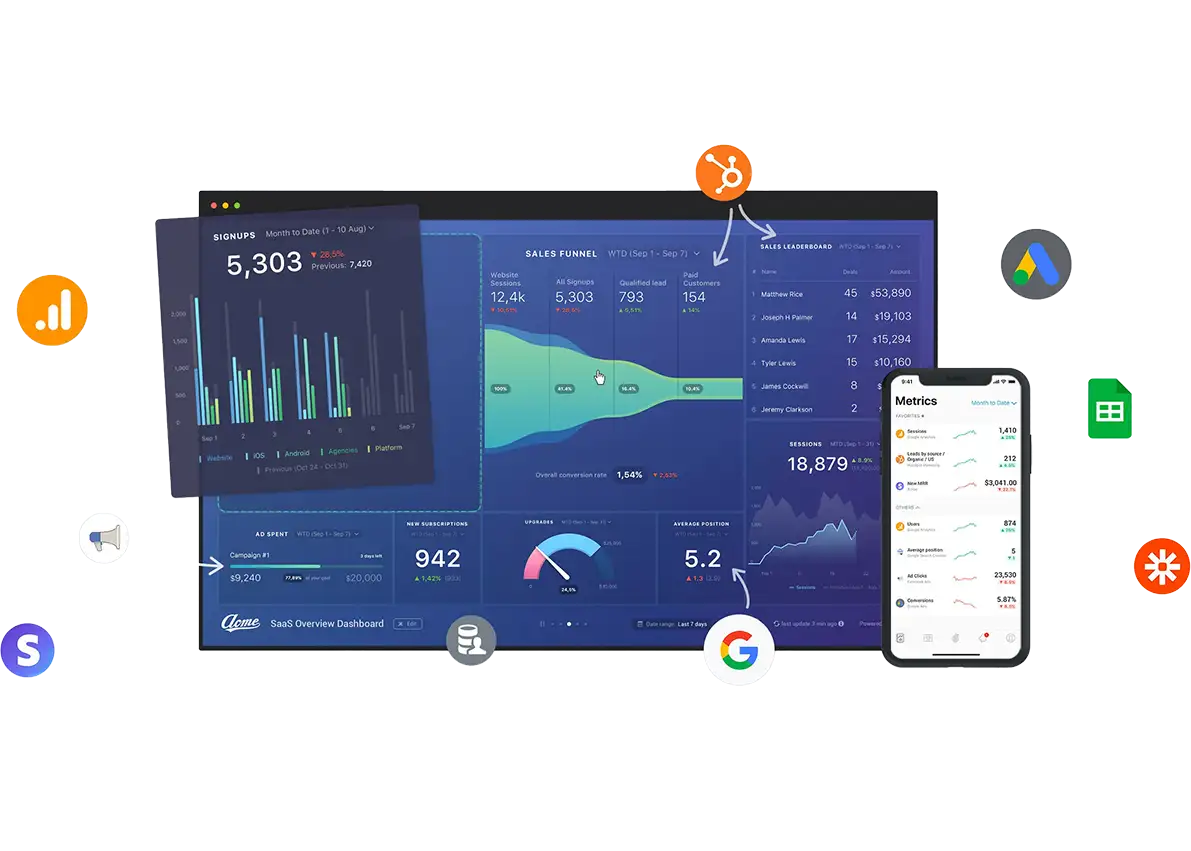
Dashboard Design
Work closely with your teams to design dashboards that are visually appealing and also provide the most relevant metrics. DataBox’s templates and customization options simplify this process. So, it is easier to create dashboards that meet specific departmental needs on the platform.
Training and Onboarding
Ensure that your team can use your reporting tool expertly through comprehensive training sessions. Emphasize the value of real-time data and collaboration to maximize the impact of your custom dashboards on business outcomes.
Key Learnings
-
1
Tailored dashboards are essential for gaining actionable insights. Off-the-shelf solutions may not meet the unique needs of every department.
-
2
The ability to access and analyze real-time data is a game-changer for businesses needing to make swift, informed decisions. It can significantly enhance the effectiveness of your strategies.
-
3
A user-friendly interface and a mobile-first design are critical for ensuring high adoption rates among users. Simplified processes for creating and accessing reports keep teams engaged and empowered.
-
4
Seamless integration with existing tools and data sources is vital when gathering business intelligence. It enables organizations to extract maximum value from their data.
Conclusion
Custom dashboards in Looker and DataBox enhance business decisions and operational efficiency. Tailor these platforms to the specific needs of your organization to access real-time, actionable insights that drive success.
If you need help integrating your marketing and sales tools and setting up comprehensive dashboards on any of these platforms, book a complimentary call with one of our automation and data specialists right away. We are happy to help.

