As a business leader, you have to make decisions for your company every day. But to make informed business decisions, you first must have the right information. While instinct and intuition determine many decisions we make as humans, critical business decisions are (should be) fueled by data.
Among its many other advantages, having access to real-time data helps you understand the current overall performance of key areas in your company, creating the foundation needed to identify business opportunities and drive business growth.
So, what are the specific data points, and how can you review them holistically? In a Management Report.
Management reports are visual documents or presentations that capture the significant activities and performance of various arms of your business, over a specific period.
By tracking, organizing, and analyzing the performance of the numerous parts of your business, you will have a clearer picture of where you need to put your and the company’s time and effort.
However, there are many data points that you can look at, and trying to understand every part and performance for every project in every department can easily leave you feeling overwhelmed, not to mention how time-consuming it would be.
So what do you need to look at as a leader to help drive the ship?
You need to look at 5 reports, and at a bare minimum, look at them once a month with your leadership team.
As you read on, we’ll walk you through each report, their importance, and how you can leverage business automation tools to get the data inputs automated and available to pull the reports from.
5 Monthly Reports for Business Leaders
1. Financial Health Report

Like a diagnosis helps to determine the state of a person’s health, a financial health report helps to show the current state of a company’s monetary situation, such as income, profits, expenses, cash flow, operating efficiency, liquidity, and debt coverage. It also helps to determine whether a company is running profitably or at a loss. It shows the viability and sustainability of a business model in both the short and long term.
In other words, a financial report is an official business document showcasing all the financial performance and activities of a company over a specific period. Usually, they are created monthly, quarterly, and/or annually.
As a CEO or CFO (Chief Financial Officer), understanding the financial health of your company is important when making key decisions, managing debt, forecasting profitability estimates, and mitigating financial errors.
A detailed financial report should include cash flow data, profitability measures, asset and liability evaluation, and shareholders’ equity analysis.
Importance of Financial Reports
- It helps to communicate essential information to c-suite leaders, partners, investors, and shareholders. These include income, profits, expenses, cash flow, operating efficiency, liquidity, and debt coverage.
- It helps to monitor revenue and expenses.
- It helps with the financial analysis process needed when making business pivots and any critical financial business decision.
- It helps to ensure compliance with the law and regulations of the government and its agencies.
- It helps to simplify and shorten the time needed for taxes.
Monthly Financial Reports to Review
As a CFO (or the person that wears this hat), your monthly financial report should show a concise overview of the business’s financial health from the previous month to have an up-to-date understanding of the profit, loss, and overall cash management. Financial reports should include:
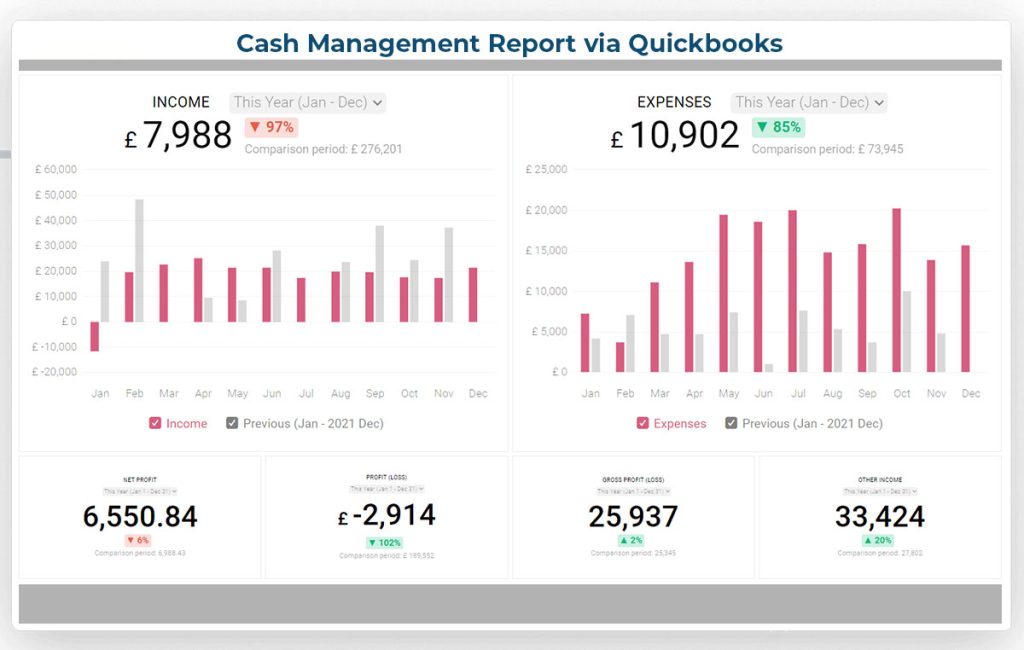
a. Cash Management: This offers a comprehensive insight into the current liquidity, income, expenses, and cash flow situation of the business.
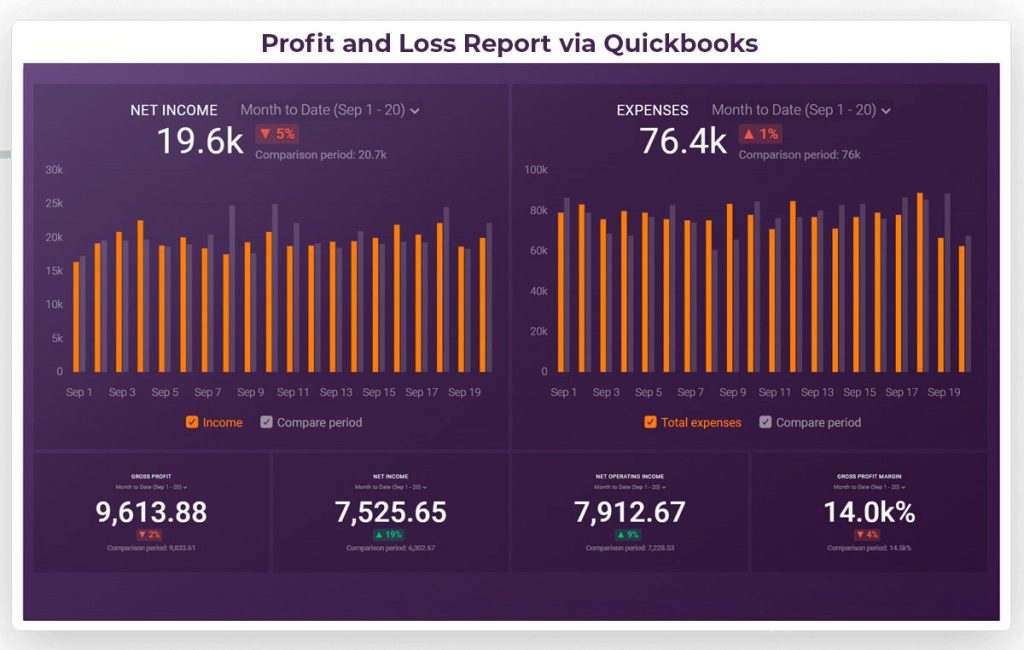
b. Profit and Loss – This data provides insight into the company’s net income, showing where your profits are coming from, debt coverage, and what and where your operating expenses are going.
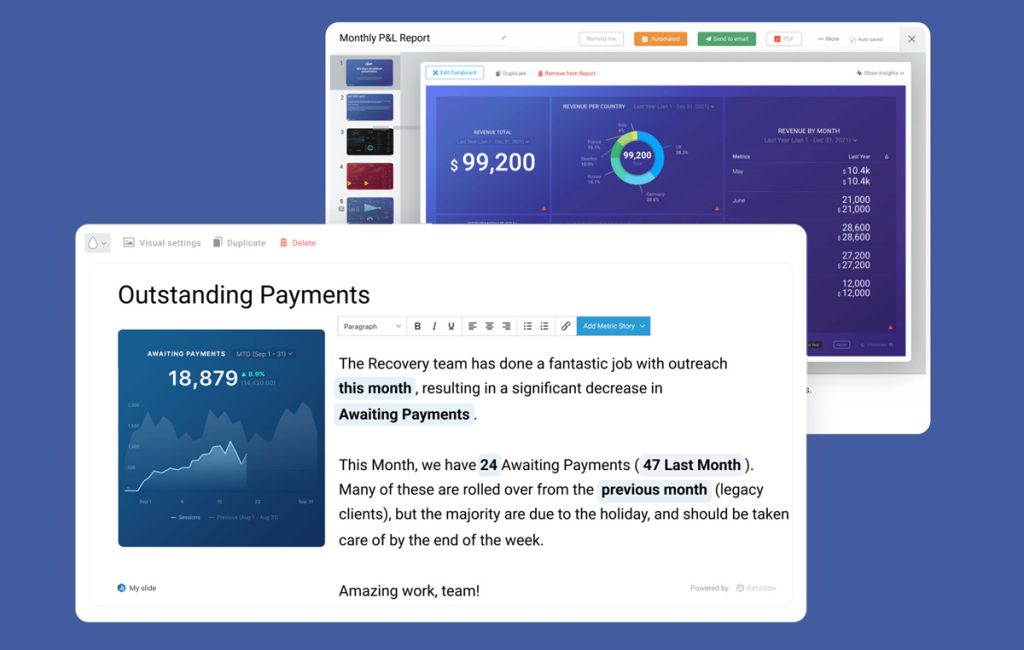
c. The Bigger Picture: This aspect of your report will suggest improvement opportunities and highlight strategies that will increase profitability. Ideally, this is a written note on top of the visual report that ties all the data points into a story and reinforces why the author believes the company should be making a specific pivot or decision.
How to Prepare Your Financial Health Report
As a business leader, besides knowing what data to present in your c-suite report, how you present the data is also important. Your report should be neat, clear, and concise You should also use business automation tools to automate your report. You’ll want to focus on the facts, main insights, and recommendations that will prompt the necessary action from your audience. So all other stakeholders can understand it.
Financial reports should visually communicate charts and graphs, and also have hard numbers to show how you did the last month specifically.
2. Customer Health Report

A customer health report shows you the level of a customer’s engagement and satisfaction with a company’s product and/or service. It includes indicator metrics that will give you an overall score for that customer, presented with a color code along with client satisfaction KPIs. This helps the viewer easily predict the likelihood of renewal, growth, or churn across its customers at a glance.
To prepare the report, you must first identify the indicator metrics for usage, engagement, and financial levels of your customers.
Usage Level: Here, you want to look out for customers who use your product consistently or otherwise, how they use it, and the kind of results they derive from using it.
Engagement Level: This demonstrates how much customers relate to or interact with your company, its resources, and its people. This includes those who read your blog posts; engage with your social media content; respond to emails; provide feedback or contact customer service. In other words, you can use the type and frequency of engagement to determine the health score of your customers.
Financial level: This shows the level of a customer’s willingness to pay for your products and/or services. Additionally, how early they pay, and how often they make the payments The financial health of a customer can be influenced by factors like your payment method, the price-to-value ratio of your plans, current needs, etc.
Color-coding your Customer Health Report
- Green Customers: This group of customers meets the usage, engagement, and financial thresholds of your business. They are top users.
- Yellow Customers: These are customers who meet some of the thresholds in the green code but not all. Here, there’s room for improvement, but they may churn if they’re not prompted or nudged.
- Red Customers: These customers are dissatisfied with your products, and their engagement with your company has been steadily declining. If left unattended, they would either cancel a subscription or rather not renew when the current one expires.
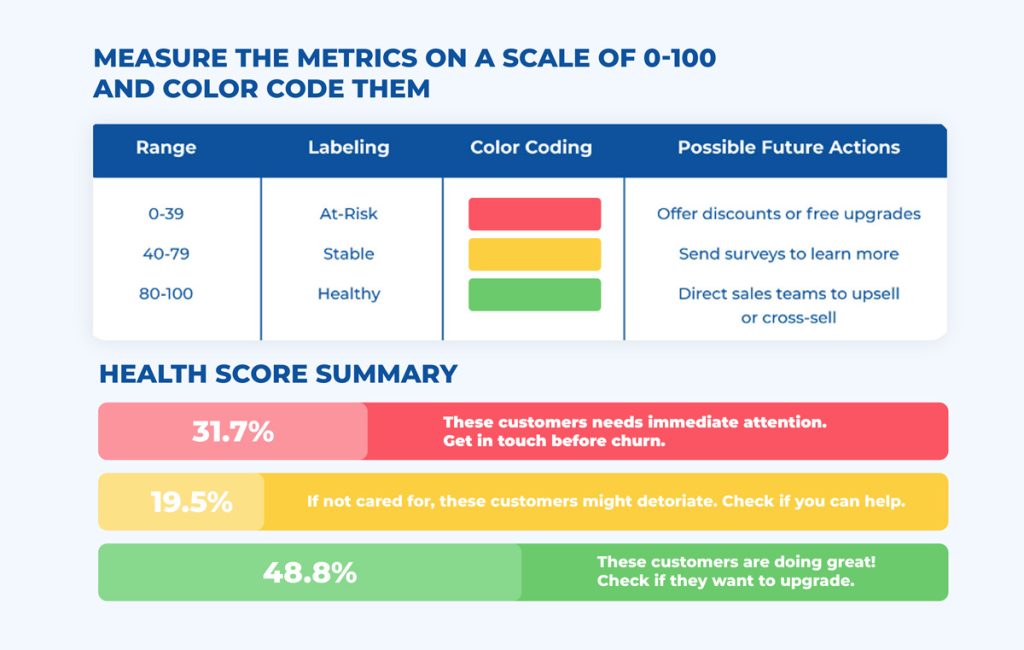
For example, 25% of customers with the highest usage, engagement, and financial levels will be in the green code, the bottom 25% in the red code, and those in the middle (50%) in the yellow code.
In a nutshell, the primary aim of this report is to paint a detailed picture of the company’s current relationship status with each customer.
Importance of Customer Health Report
As the Director of Customer Success, you’ll need to prepare and share this report with other company leaders and stakeholders to:
- Enhance Decision Making: A customer health report helps business leaders make critical decisions on service delivery, product development, pricing, and customer support for example.
- Scale and Speed Up Communication: This report also gives an insight into the company’s communication level with different sets of customers. It shows those customers who speak the loudest, those who need a little prompting, and those who no longer communicate with your brand. This can show a trend on who these segments are, the people or teams they’ve worked with, or the products they’ve purchased.
- Prioritize Customer Support: It assists in identifying customers and their likelihood to grow, renew, or churn, allowing you to prioritize them appropriately.
- Forecast Customer Success Operations: With a customer health report, you can identify and address risks before they get out of hand, recognize patterns that lead to unhappy customers, prompt customers in the yellow code, and prioritize green code customers.
- Learn Areas of Improvement for Products: It also shows you where to improve your product and/or service through feedback.
What Should Be Presented in the Customer Health Report?
a. Churn
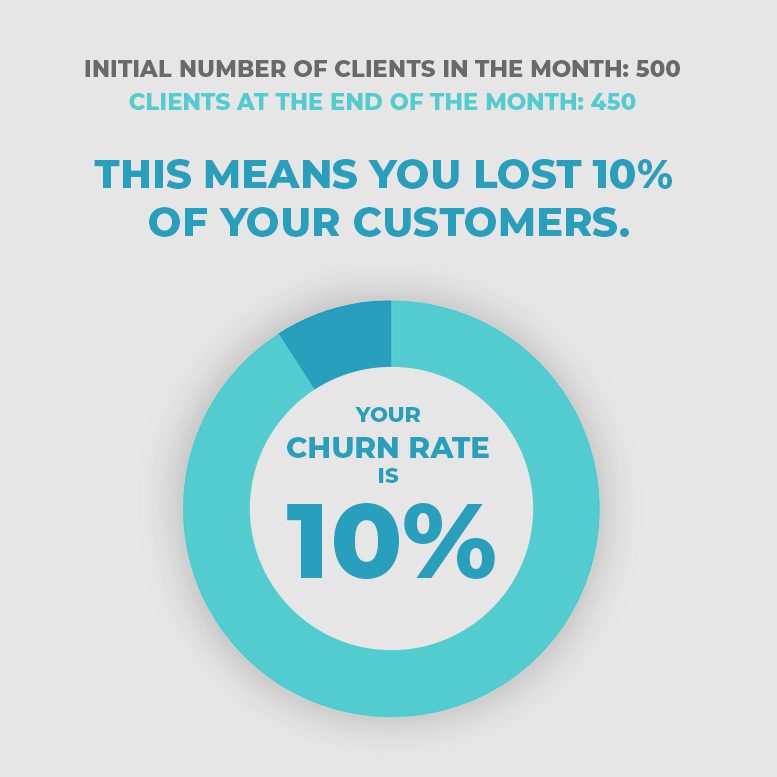
Customer churn is defined as the percentage of customers who stop engaging with a company’s content or utilizing its product or service over a certain period. You can calculate the churn rate by dividing the number of customers lost during that period—say a month or quarter—by the number of customers you had at the beginning of the period.
For example, if you start the month with 500 customers and end it with 450, your churn rate is 10%. This means you lost 10% of your customers.
b. CSAT (Customer Satisfaction Index).
This is defined as the rate of customer satisfaction with a business, product, service, content, or interaction. Calculate CSAT by asking customers to rate their satisfaction on a scale of 100%, 1-10, or a 5-star rating. Thereafter, divide the sum of all positive responses by the total number of responses received. For example, if you received 50 responses and 35 were positive, your CSAT would be 70% ((35/50) x100 = 70%).

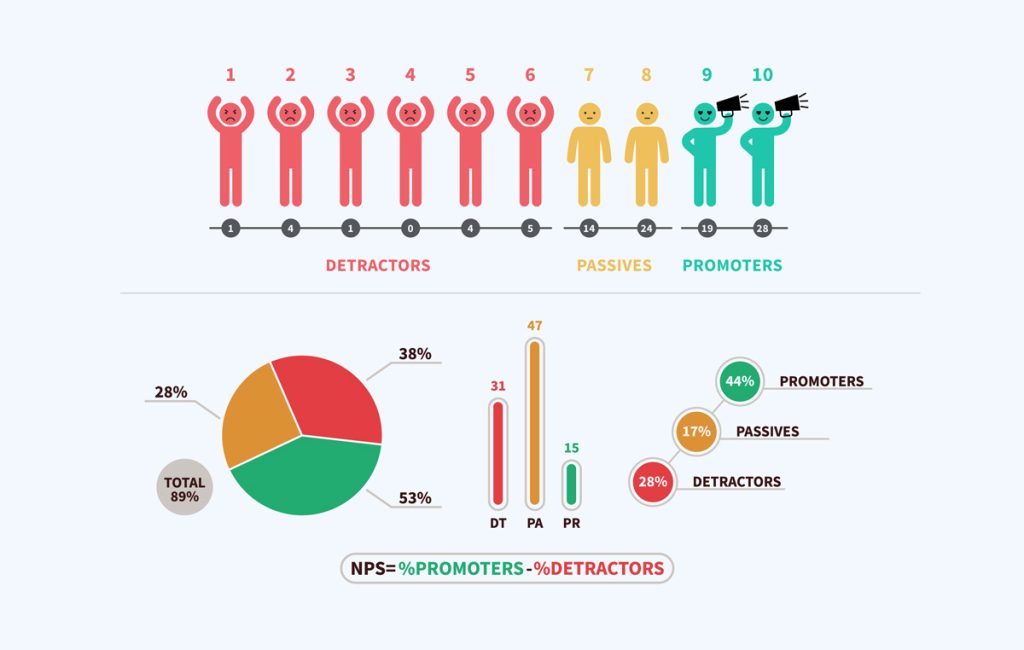
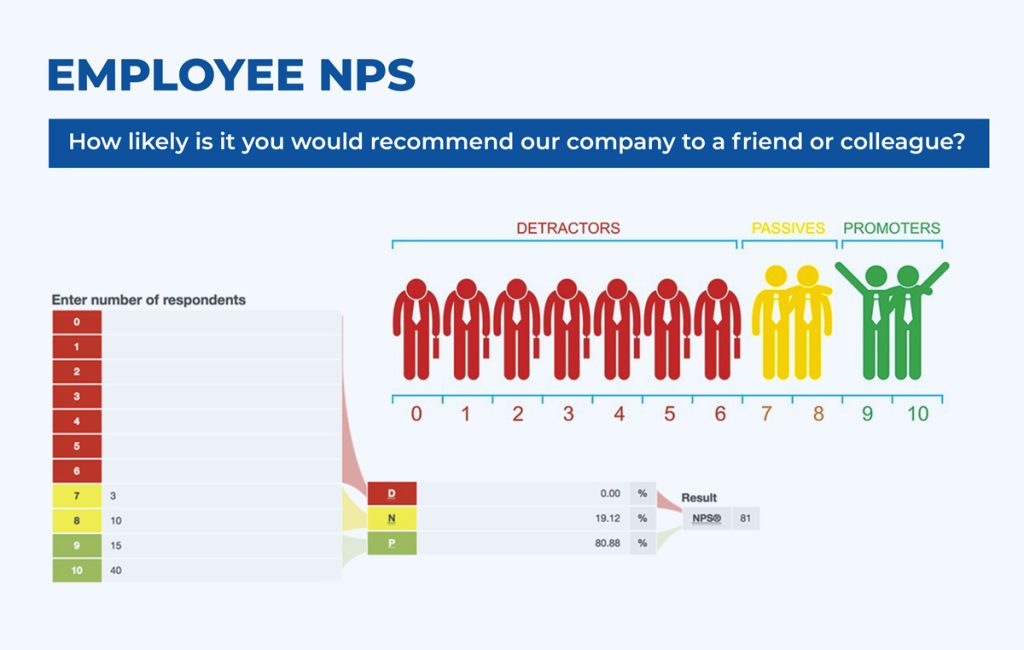
c. NPS (Net Promoter Score)
This is a customer experience metric used to measure the loyalty of customers to a business. An NPS score ranges from 0 to 10. To get this, ask customers if they would likely recommend your product using a scale of 0(not at all) and 10 (extremely likely). Then, you can further group respondents into 3 categories.
- Promoters: Those who gave a 9 or 10 rating (enthusiastic and loyal customers).
- Passive: Those that responded with a 7 or 8 rating (happy customers but not loyal enough to be promoters).
- Detractors: These are customers who give 0–6 ratings (unhappy customers who are unlikely to buy from you again or recommend your products).
d. Accounts in Jeopardy
This refers to accounts or customers who are likely to churn. Accounts often go into jeopardy when there’s only one point of contact, the account history is missing, customer complaints are becoming a pattern, or the account doesn’t know how to use your product.
e. The Number of Stars and Reviews
The number of stars and reviews across platforms shows how much customers engage with your business and their level of satisfaction with your products.
How to Prepare Your Customer Health Report?
When preparing a c-suite report on customer health, your data and metrics should be presented in a neat, clean, and concise manner. It should equally contain suggestions and lines of action on how to improve the health score of each customer.
3. Human Resource Report

An HR management report showcases all human resources-related stats, facts, metrics, and insights with the primary aim of improving workforce performance, recruiting procedures, and other relevant HR operations.
By using various HR-driven metrics, HR managers can identify trends, inefficiencies, strengths, and weaknesses in some key areas, ensuring that your HR activities, efforts, and initiatives are at optimum levels.
Importance of HR Management Report
- Identifying Weaknesses: An HR report helps the organization identify weaknesses concerning its human resources. This report identifies the strengths and weaknesses of each team within different departments.
- Tracking Employee Performance: An HR report tracks each employee’s performance. With this report, each manager can bring up their team’s scores, ask for feedback on their performance and talk through ideas to improve each.
- Plan for the Future: As the HR report reveals employees’ performance and what needs to be improved upon, this helps to modify the company’s future hiring requirements and department roles.
What Should be Presented in the Human Resources Report?
a. Velocity Report
This report shows the amount of work done or value delivered by employees during a period. It also helps you understand how much work employees can handle and how fast they can get it done.
b. Team Satisfaction Score
A team or Employee Satisfaction score is a metric used to determine the level of employees’ contentment with their roles and the organization at large. This report shows an overview of the satisfaction levels of each employee, the probability that they’d be staying in the organization, and the possibility of recommending the company to others. A higher employee satisfaction score helps to create a positive working environment, increase team productivity, improve brand image, and get better team feedback.
c. Complaints Reports
This report shows complaints and dissatisfaction from employees regarding challenges they face in the workplace, the outcome of the problem, and possible suggestions on how to fix the problem.
How to Prepare Your HR Report?
To create an accurate report, gather the necessary data in the areas of employee management, productivity, complaints, and satisfaction. Use the data to filter the records to keep only those necessary for the report and any subsequent questions.
Add respective KPIs using different timeframes (like daily, weekly, and monthly) to compute your data, uncover trends, and interpret them. Use business automation tools to share your results, and define your next steps.
4. Projects Report

Another important management report to review monthly is the Projects Report. A project report provides only the high-level and important status details about current projects. It contains the objectives, goals, analysis, and recommendations for the project.
Importance of Projects Report
- It provides clarity: Writing a project report gives you and other business leaders a clear path to project execution. It helps to develop strategies and skills that will make the project successful.
- Proper allocation of resources: As a leader, a project report will help to successfully allocate resources to various aspects of your project and bring it to a positive conclusion.
- Threat Identification: A project report will predict and identify threats, as well as areas of weakness in a project. You’ll equally forecast and learn the right plans to avoid or correct them in the future.
- Prevents Wastage: Creating a project report with updates will reduce the risk of making mistakes, and wasting money, time, effort, and resources.
What to Include in a Project Report?
a. High-Level Project Overview
This is a project overview that considers the time, effort, resources, and objectives required to execute a project and how to manage all these monthly. It helps to create milestones for the team, track the project’s progress, and provide insights to your team on how to adjust their efforts to meet the goal when necessary.
b. Project Milestones
Milestones are markers or specific points within the life cycle of a project, used to measure the progress toward the ultimate goal of the said project. These points often mark the start and completion of major phases within the project plan. Milestones indicate key events and forward movement in the project plan, helping to ensure that the project team stays on track. They are used as a scheduling tool to break larger projects into small, manageable parts. include the milestones covered in the past month to show how much progress you made on the project within that time frame.
c. Time Allotted to the Team
This report shows the total amount of time dedicated by the team to the project during the period under review. It should show the number of hours daily or weekly dedicated to the project by each team member.
d. Time Frames
This is the list of major phases or milestones of a project with the target date for achieving them. It provides a comprehensive overview of the project from start to finish by chronologically listing the tasks within it.
e. Project Prioritization
This is usually an overview of tasks you have had to prioritize and those you moved backward due to importance levels, new developments, or emergencies (potential and existing). You should also include specific reasons for your decisions.
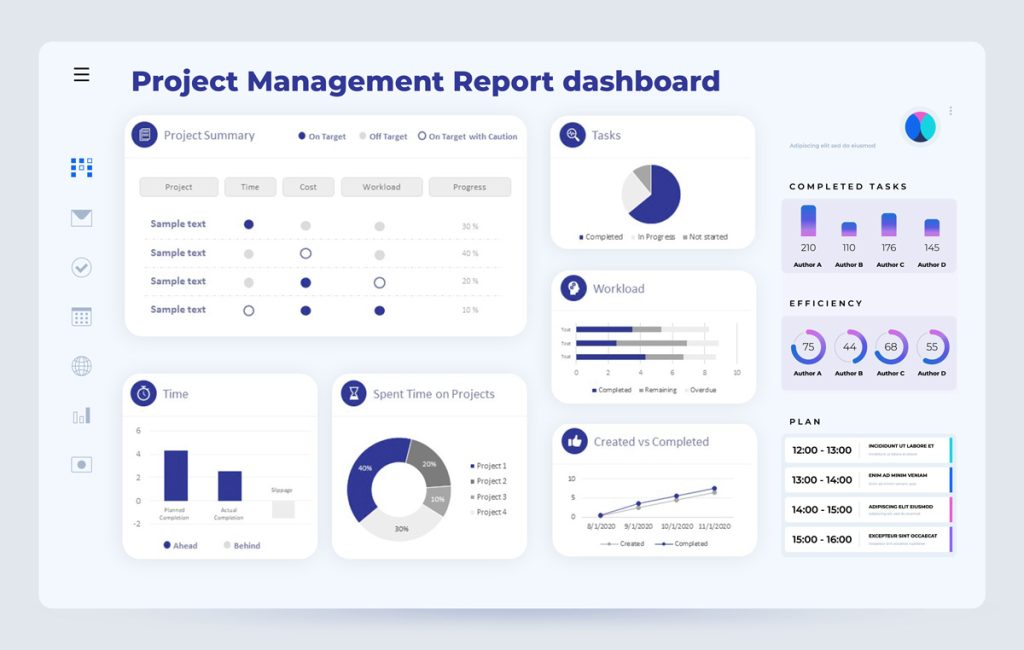
How to Prepare Your Project Management Report?
For project management reports, think of high-level reports, milestones, dedicated team hours, prioritization, an estimation of time frames, etc. Ensure that what you’re sending are things that are important to the leaders of the company, without too many details that can overwhelm them, and send them in an easily understandable format. Use infographics, spreadsheets, pie charts, bar charts, and so on when and where necessary for data representation.
5. Lead/Marketing Health Report

A marketing report is a detailed document that tracks and analyzes your marketing efforts, performance, and results and converts them into real-time data to inform future marketing strategies, decisions, and actions. It reveals useful, actionable data that helps you make important marketing decisions to meet your business objectives.
Each marketing report varies depending on the data you’re reviewing and the purpose of each piece. For example, you may decide to analyze your leads and traffic data, your conversion ratio, content engagement, and so on.
Importance of Marketing Report
Besides helping you stay on top of marketing performance, here are some other useful things that a marketing report will do for you:
- Tracking Campaign Performance: A marketing report tracks individual campaign performance across all marketing channels, telling you where your efforts are getting the most results and where performance needs a boost.
- Full Story Marketing Metrics: The marketing report tracks and gives you access to all your marketing data, including KPIs, from all marketing channels in one place.
- Understanding Customer Behavior: As the Chief Marketing Officer, a marketing report provides insights into your audience’s behavior to help you understand them better. For example, it will show you what kind of content gets the most engagement on social media, the variety of devices your target customers use, what type of product they’re likely to buy, and how much they’re willing to spend on your product or services, etc.
- Marketing Campaign Optimization: With all the data provided, it becomes easy to optimize your marketing strategies. You will understand what works and what doesn’t. For instance, if most of your leads come from social media, you may want to optimize your social media marketing.
What to Include in the Marketing Report?
a. Marketing Channels
The marketing channels used by your team should be stated with their KPIs analyzed and revealed in your report.
For instance, if you have marketed through search engines, emails, print advertising, television, social media, offline promotions, and digital board advertising, relevant metrics and results from each channel should show in your report.
b. Lead Quantity
Lead Quantity is the sum of all leads generated across all marketing channels in a month. When you track and analyze, and report the number of leads generated, every stakeholder will have insights into the efficiency of each marketing channel since everyone can see where each lead came from.
c. SQL Conversion Rate
The sales-qualified lead conversion rate is the number of leads generated that are qualified to make a purchase. Adding SQL to your monthly report will help you learn the quality of leads generated through your marketing channels. It is also a direct reflection of the efficiency of your marketing strategy and sales funnel.
d. Campaign Efforts Data
This report is usually an overview of your overall marketing campaign efforts during the period under review. It shows the various marketing channels used, the number of leads generated, the number of SQL, ad spend, cost per lead, and other relevant metrics that can help drive informed decisions.
How to Prepare Your Lead/Marketing Health Report?
When creating your marketing report, ensure the important details or data come first and have visual representations.
A study by Cornell University reveals that the human brain processes visual data 60,000x faster than written data. And that illustrated data (e.g. graphs and charts) is more believable than written data. When possible, include images, charts, and graphs in your marketing reports. Thereafter, automate. This saves you time while helping other leaders understand it better.
Helpful Tool for Business Analytics, Reports, and Data Presentation
To present your data accurately, concisely, and in ways another business leader will quickly understand in one place, consider Databox.
Why Databox?
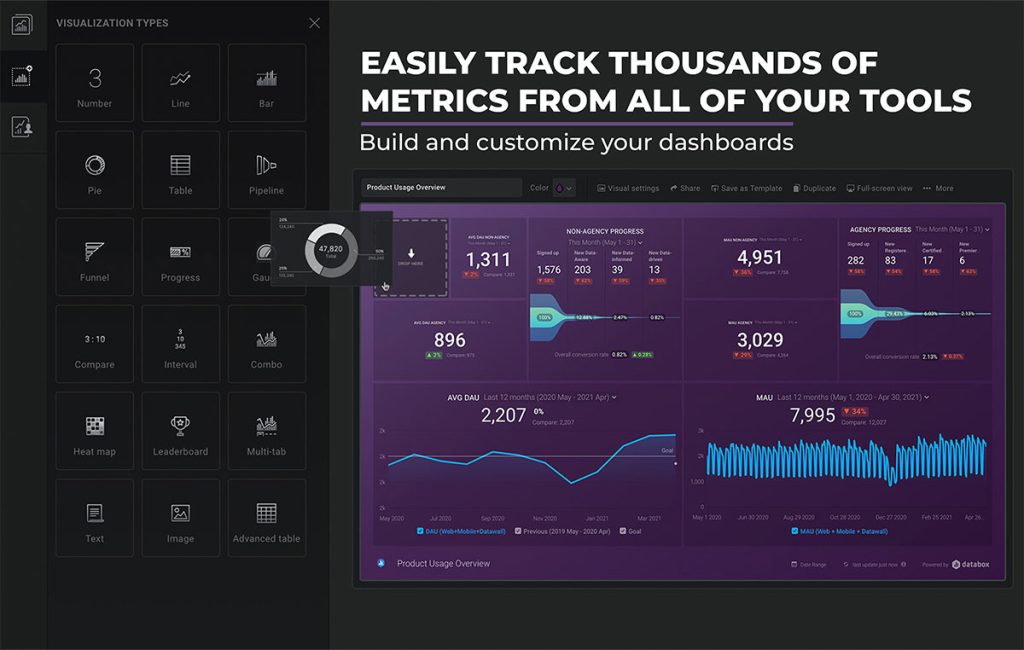
Databox is a data presentation tool that makes it possible to centralize various marketing, HR, financial, customer relationship, and project reports into one location so you can get a full picture of how your company is doing.
- With Databox, you and your team can connect your data, build and share reports, monitor trends, discover new insights, and automate reports with fewer efforts.
- Databox has customizable templates for multiple departments.
- They allow you to use their integrations or build your own.
- You can set weekly updates for the leadership team using its automation feature.
Let’s Recap
Reviewing information from key departments within your company has countless advantages. Along with assisting you in managing your business affairs and making important decisions, it also improves your understanding of your employees and customers.
The financial, project, customer health, marketing, and human resources are management report examples to be reviewed monthly for optimum business oversight.
With the aid of data automation and reporting tools like Databox, you’ll be able to simplify the mundane, time-consuming tasks associated with report writing. And by doing so, you’ll have more time to concentrate on creating new growth-oriented initiatives.
If you need help with research-backed Business Strategy and Business Reports Automation, book a free consultation with us.